$99.00 $7.00
Forex traders identify the Fibonacci retracement levels as areas of support and resistance.
Because of this, the levels are watched by many traders, which is why the Fibonacci Golden Zone
strategy could be a difference maker to your trading success.

Leonardo Pisano developed a simple series of numbers that created ratios describing the natural
proportions of things in the universe. And these numbers have been used by traders now for
many years!
Your charting software should come with a standard Fibonacci retracement tool; however, you
are the one that puts this on your chart. The bottom line is that many traders use this tool which
is why it is highly important to have a trading strategy that uses this.
You are going to need to know where to apply these fibs. You will need to place them on
the swing high/swing low.
A Swing High is a candlestick with at least two lower highs on both the left and right of itself. A Swing Low is a candlestick with at least two higher lows on both the left and right of itself.
A quick thing to remember about this: if it is an uptrend you want to start with the swing low and
drag your Fibonacci level all the way up to the swing high. If it’s a downtrend you start with the
swing high and drag your cursor all the way down to the swing low.
Now, what if we told you there is a simple way to draw the Fibonacci retracement levels on your price chart.
What if everything is done automatically?
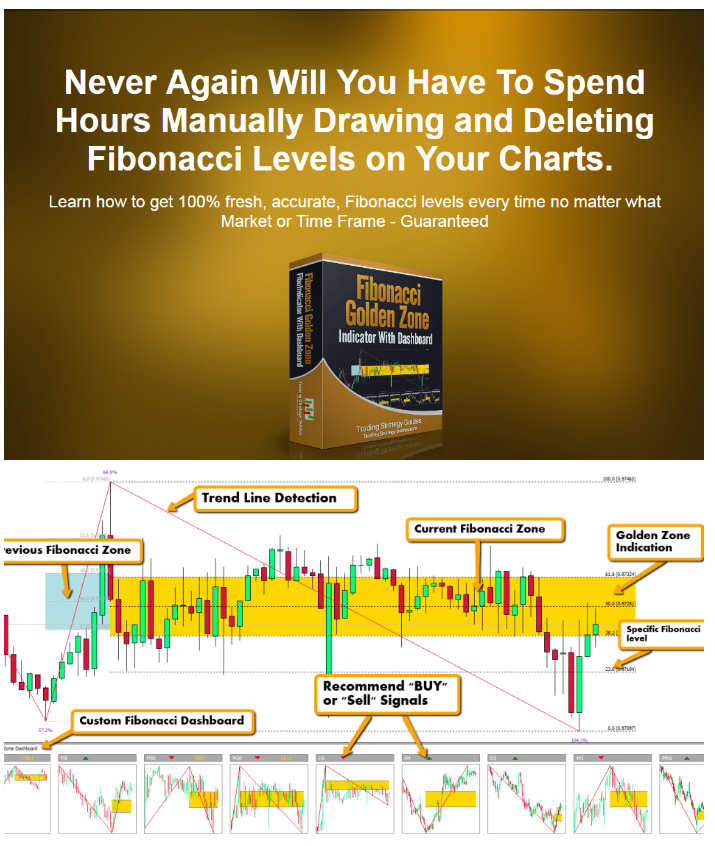
Well, our team at Trading Strategy Guides has developed a proprietary Fibonacci Golden Zone
indicator that once placed on the chart it will instantly plot the Fibonacci retracement levels of
the last swing.
You’ll not need to pick by yourself the swing high/low levels as the Fibonacci Golden Zone
indicator will do the job for you.
Forex traders identify the Fibonacci retracement levels as areas of support and resistance.
Because of this, the levels are watched by many traders, which is why the Fibonacci Golden Zone
strategy could be a difference maker to your trading success.
The Golden Zone is represented by the price area between the 38.2% and 61.8% Fibonacci
retracement. Obviously, the 61.8% is the most critical number in our strategy.
Now that we’ve learned the importance of the Fibonacci retracement levels and why they work
in analyzing the financial market let’s have a look at the rules of the Fibonacci Golden Zone
Strategy.
Only logged in customers who have purchased this product may leave a review.
 ALL COURSES
 EBOOKS
 FOREX EA’S ROBOT
 FOREX TRADING SYSTEM
 CRYPTOCURRENCY COURSES
 FOREX INDICATORS
 E-COMMERCE
 Gifts, Sports
 Menu image
Reviews
There are no reviews yet.